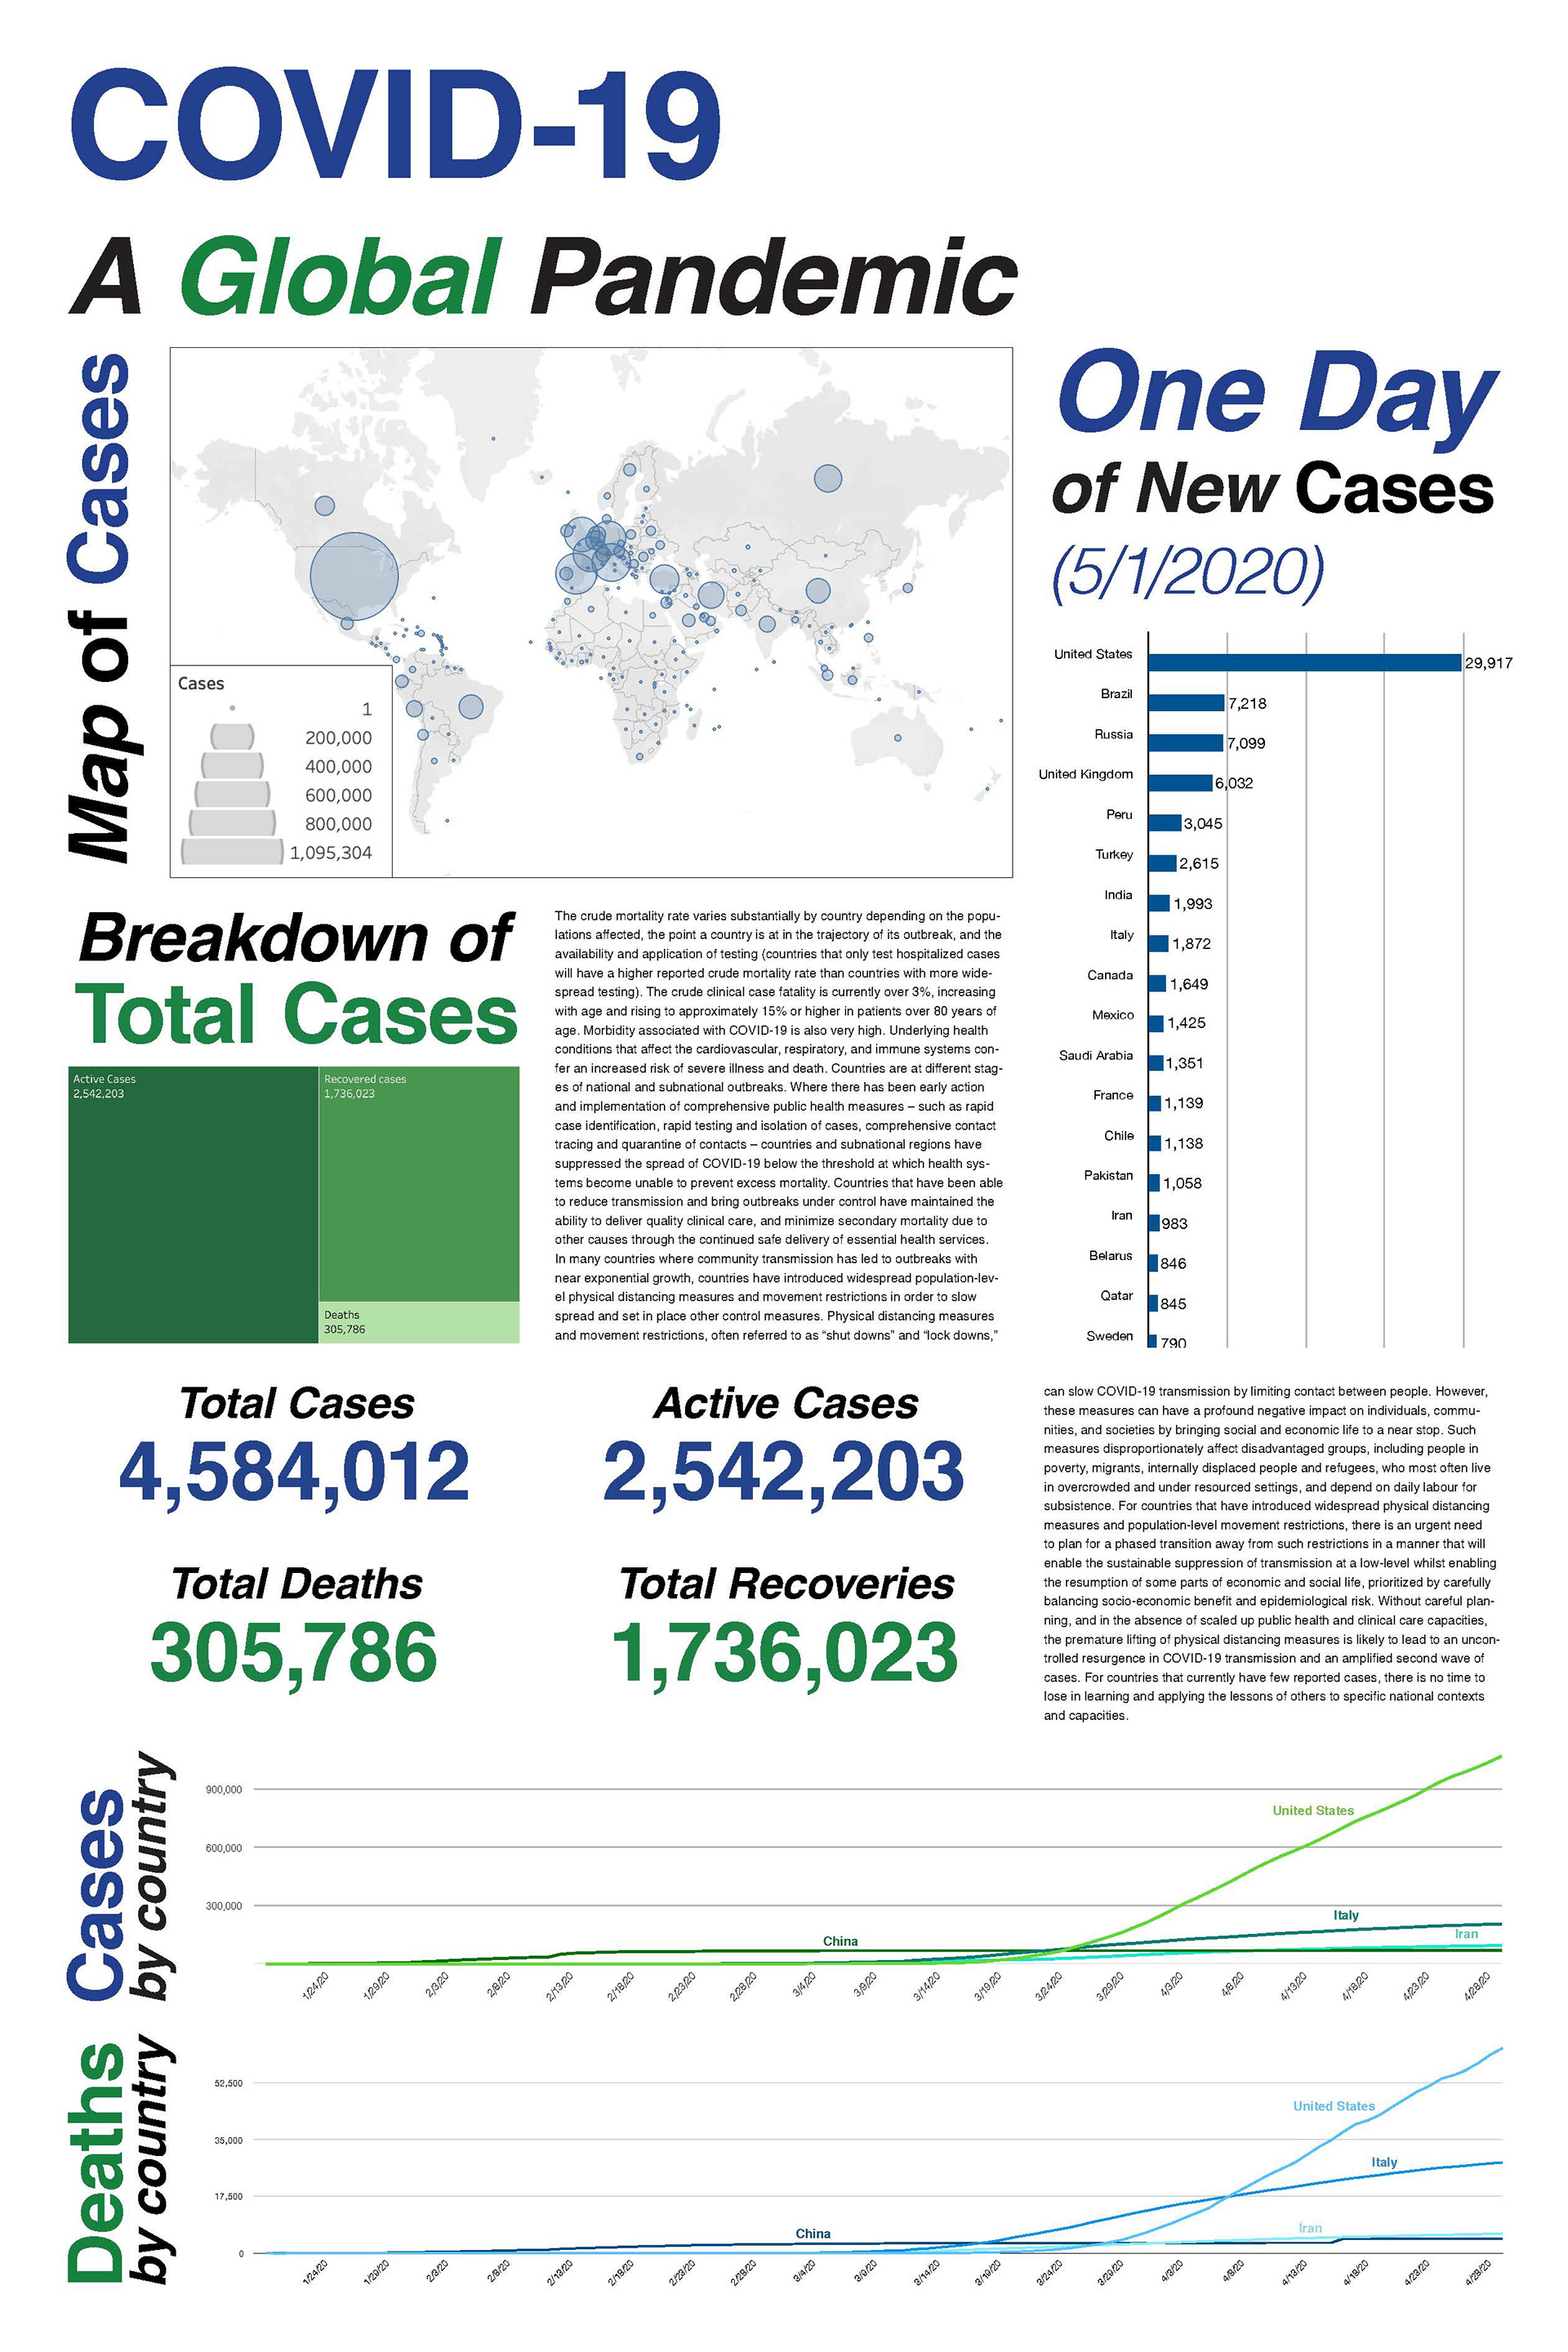
This is a Data Visualization poster of the COVID-19 pandemic global figures circa May 2020. It displays multiple forms of charts and graphs to understand data in terms of space, time, and scale using software from Microsoft Excel, Numbers, and Tableau.